Case Study: Life cycle costs of IT products
This article presents an initial case study from IT product portfolio management, more precisely from the area of IT product cost development. The example core question is:
How are the costs of the IT product for Change and Run developing?
Case study from IT product cost development
This article takes a closer look at the opportunities offered by IT product portfolio management by using a case study to illustrate the development of IT product lifecycle costs and suggest ways to optimize them.
The example core question is:
How are the costs of the IT product for Change and Run developing?
Change refers to the one-off development or customizing of an IT product, while Run stands for the ongoing maintenance of the IT product. But what exactly is the IT life cycle?
What is the life cycle of IT products?
The IT life cycle describes the phases from the creation to the decommissioning of IT products, systems and platforms. An evaluation from the perspective of the IT lifecycle has several advantages. This creates a more complete and therefore more sustainable basis for decision-making. This helps with such considerations, for example.
- When deciding between in-house development or standard software, it is important to consider the total costs when comparing the two solutions.
- The question of what costs the customer will incur for the continuation of the application, assuming an end of life.
- When it comes to the question of when an old system should be replaced by a new one.
Back to the core question: How are the costs of the product for Change and Run developing? And what do the above-mentioned life cycle costs consist of? To answer this, let’s first look at the initial situation.
Initial situation and question
The budget for IT products is made up of the one-off development services or customizing of standard products (Change) and the ongoing maintenance costs (Run), which ensure the operation of the product. Together they form the life cycle costs of a product. Experience shows that in the cost development of IT portfolios, the proportion of new functions and processes gradually decreases compared to maintenance costs. With IT budgets often limited, the proportion of change is decreasing (see Figure 1). As a result, fewer and fewer functions are being provided despite increasing demand. This leads to a so-called “application backlog“.
Development of life cycle costs
We will show you this below using a practical example. For this purpose, we use data from the BAMAC GROUP database, which we have alienated using a neutral name (product 1 and 2). In order to make the procedure transparent and clear, two products were selected and their productivity was determined. Both products are developed in the first year and subsequently expanded.
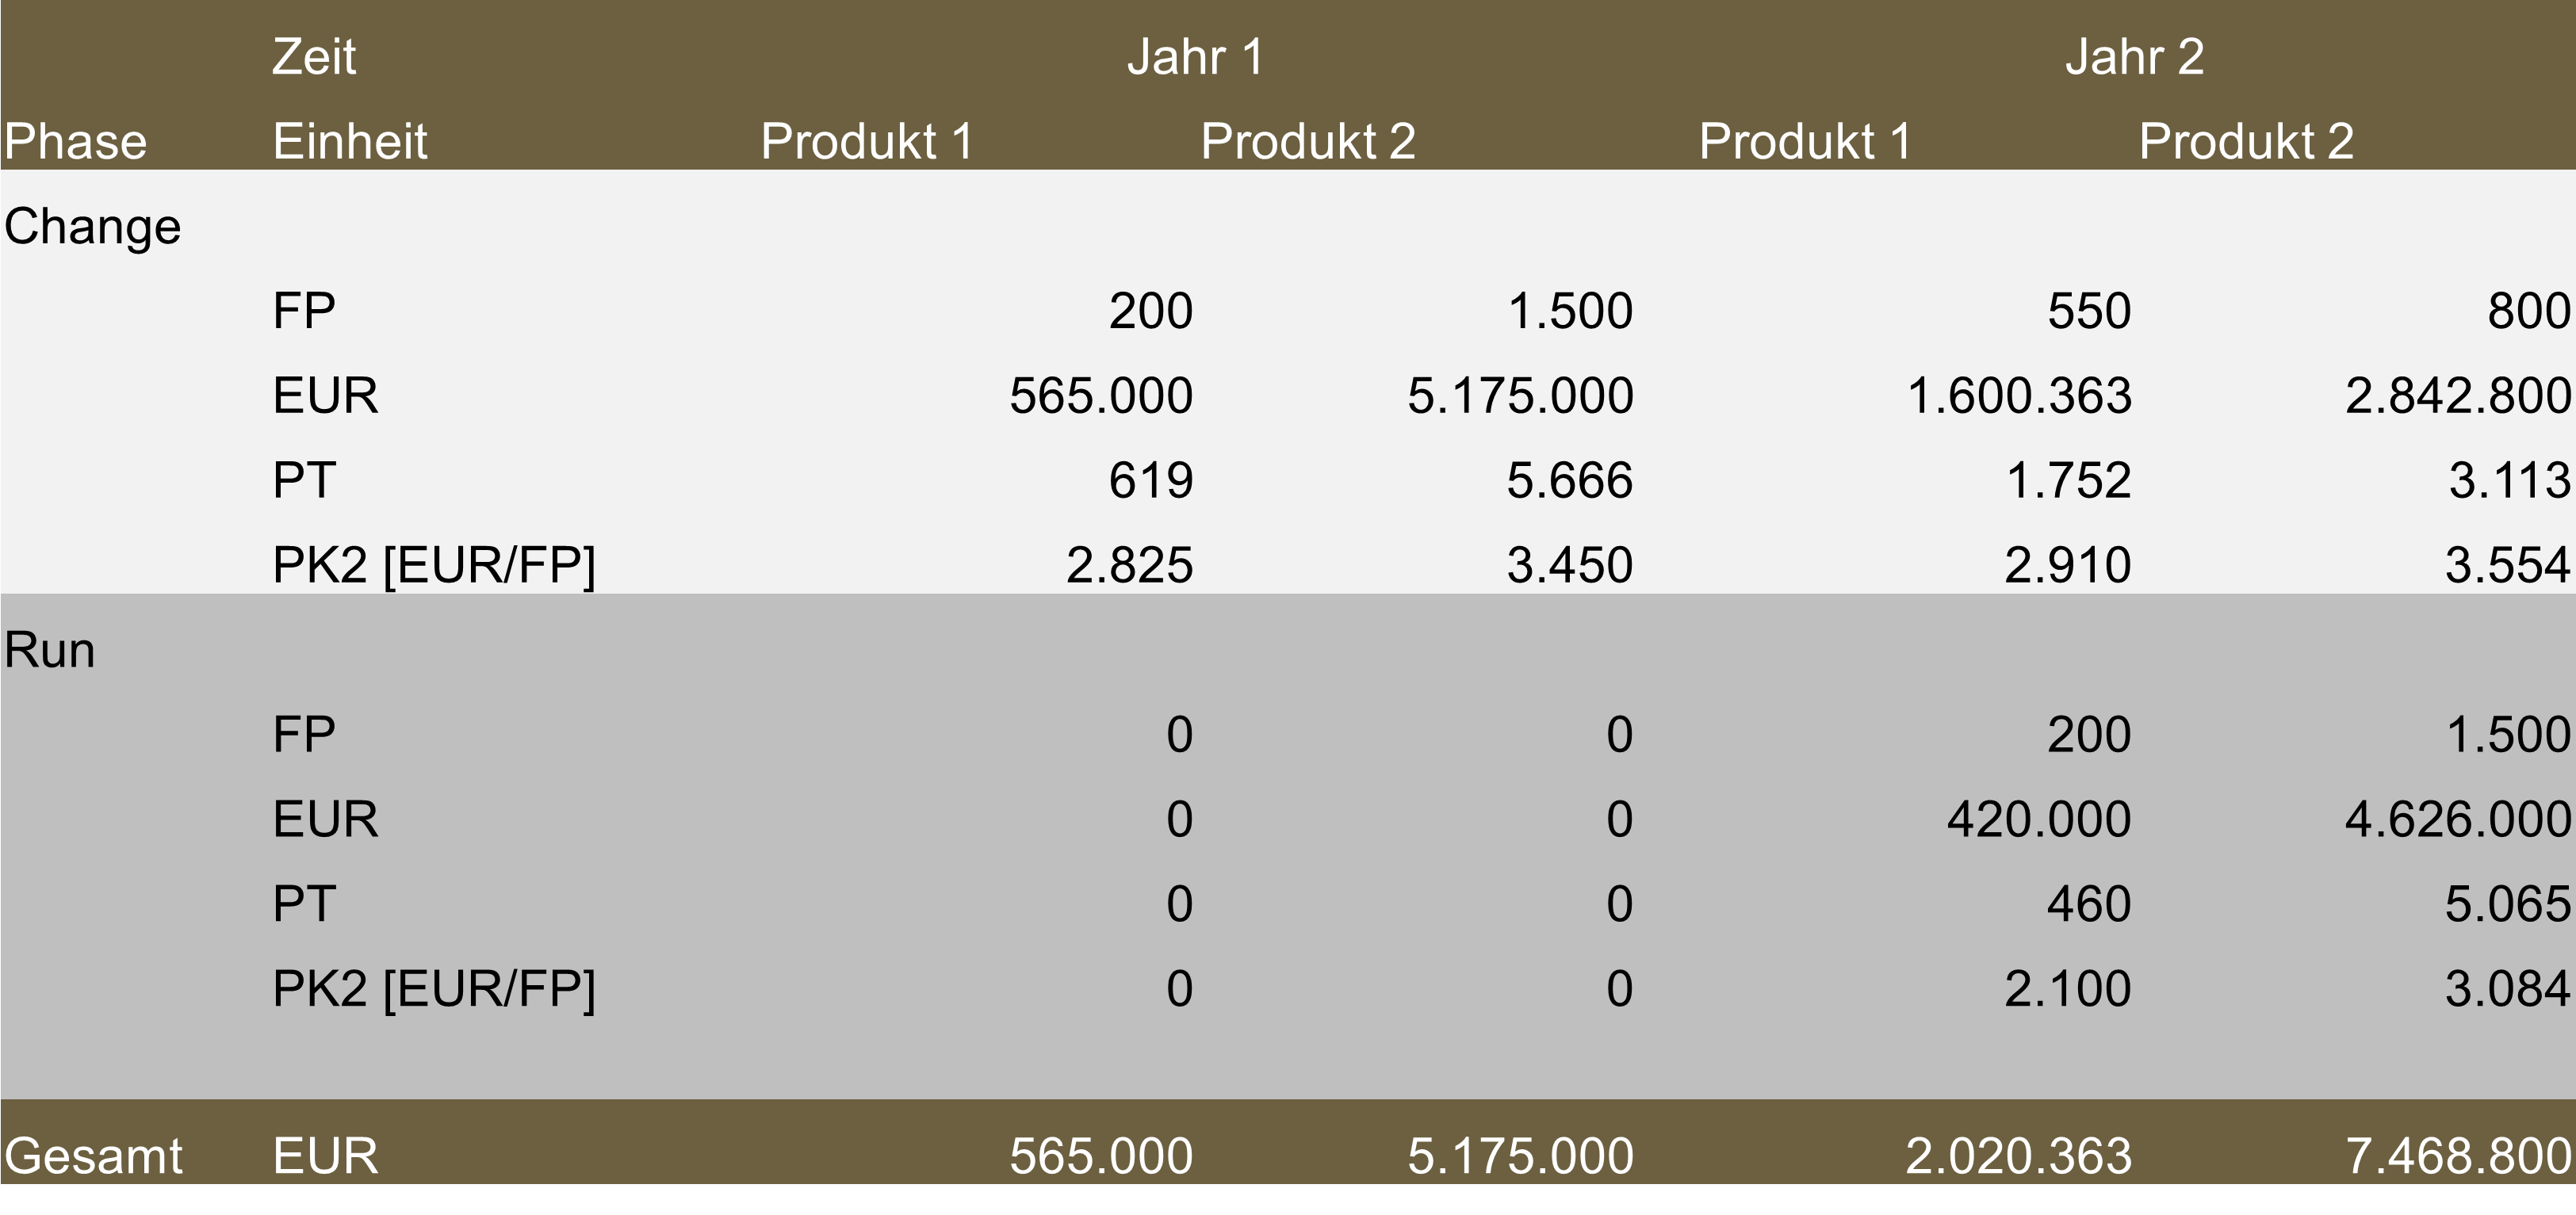
Due to the special situation that all products are developed in the first year, no maintenance costs are incurred (see Table 1).
Maintenance costs are calculated on the basis of the cumulative functions of the IT products up to the previous year.
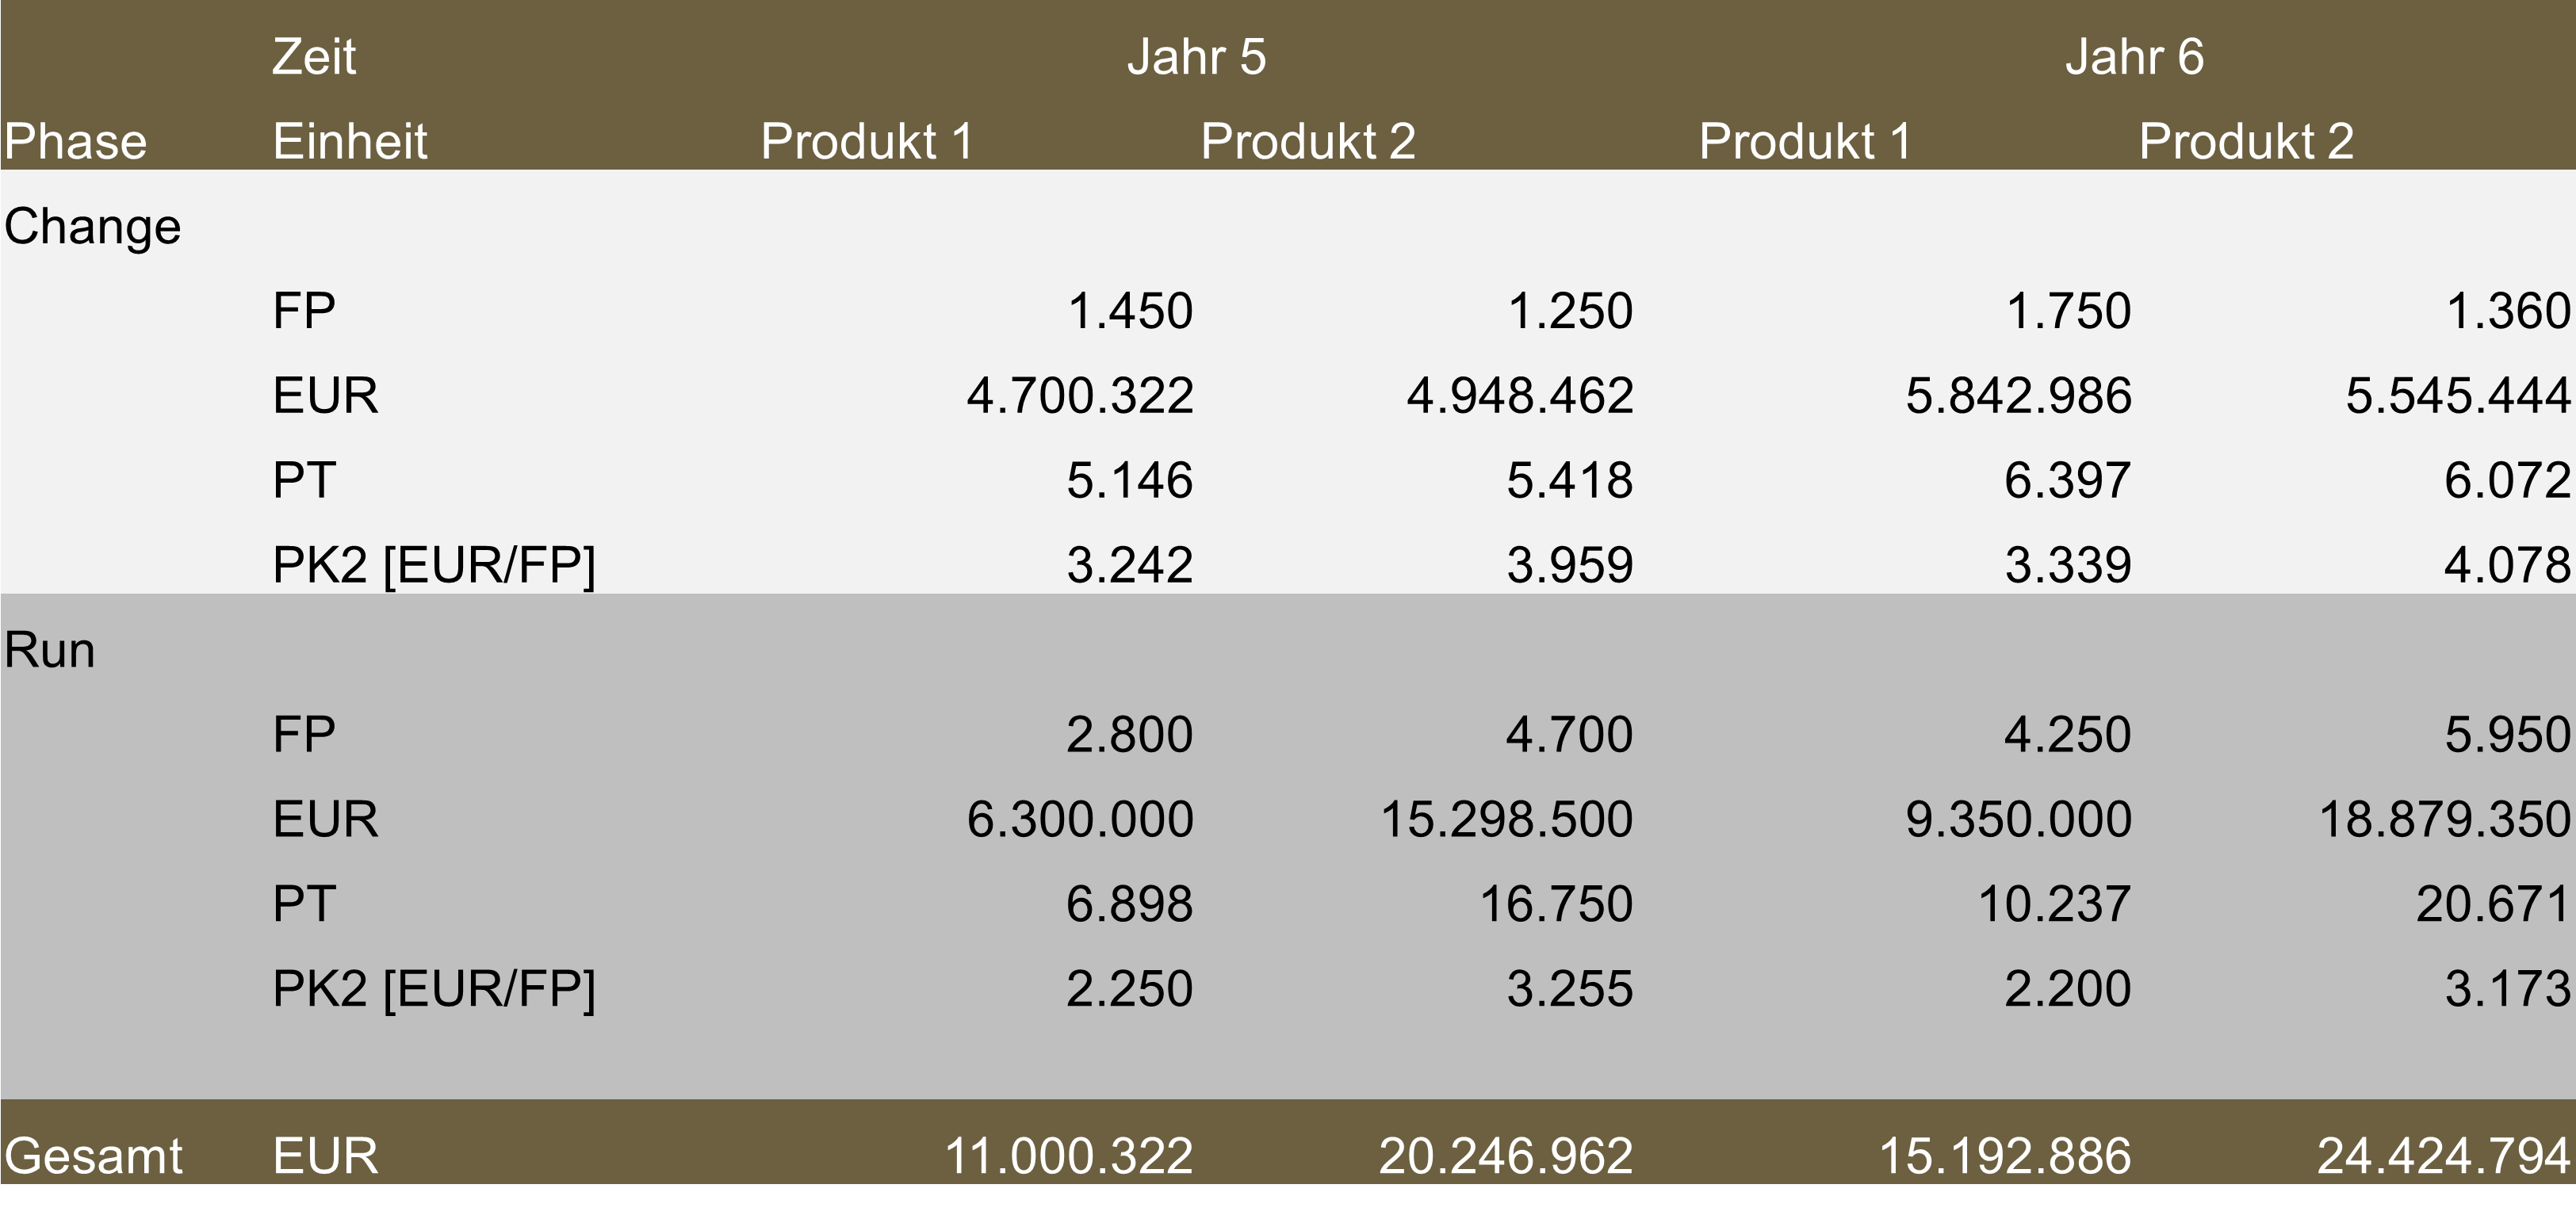
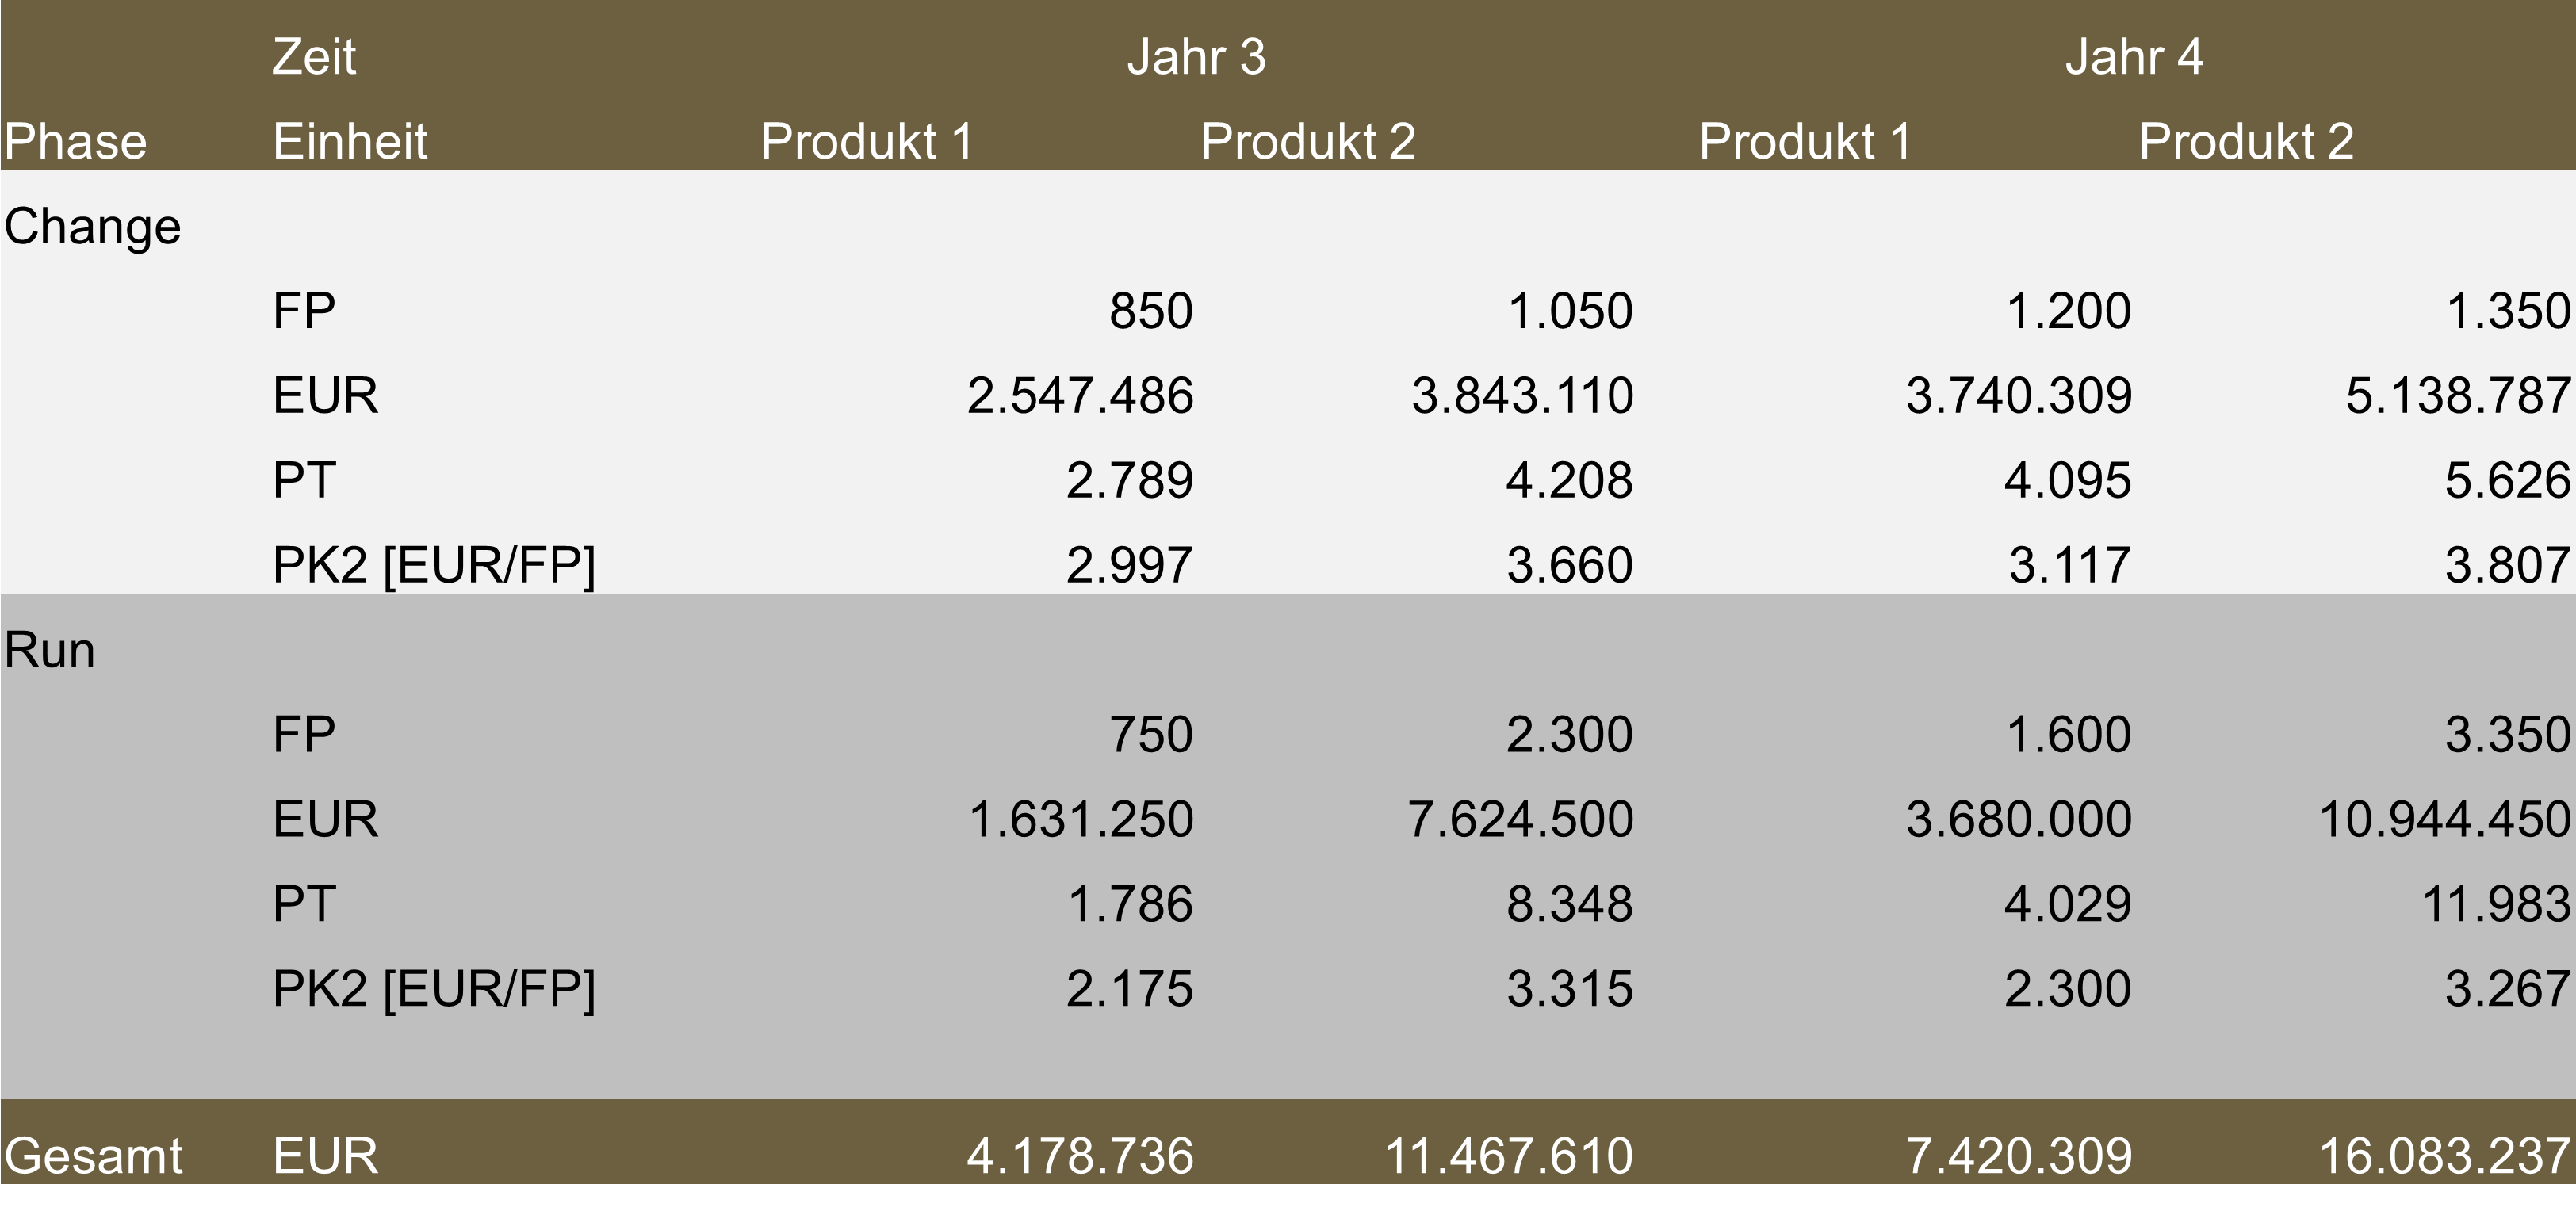
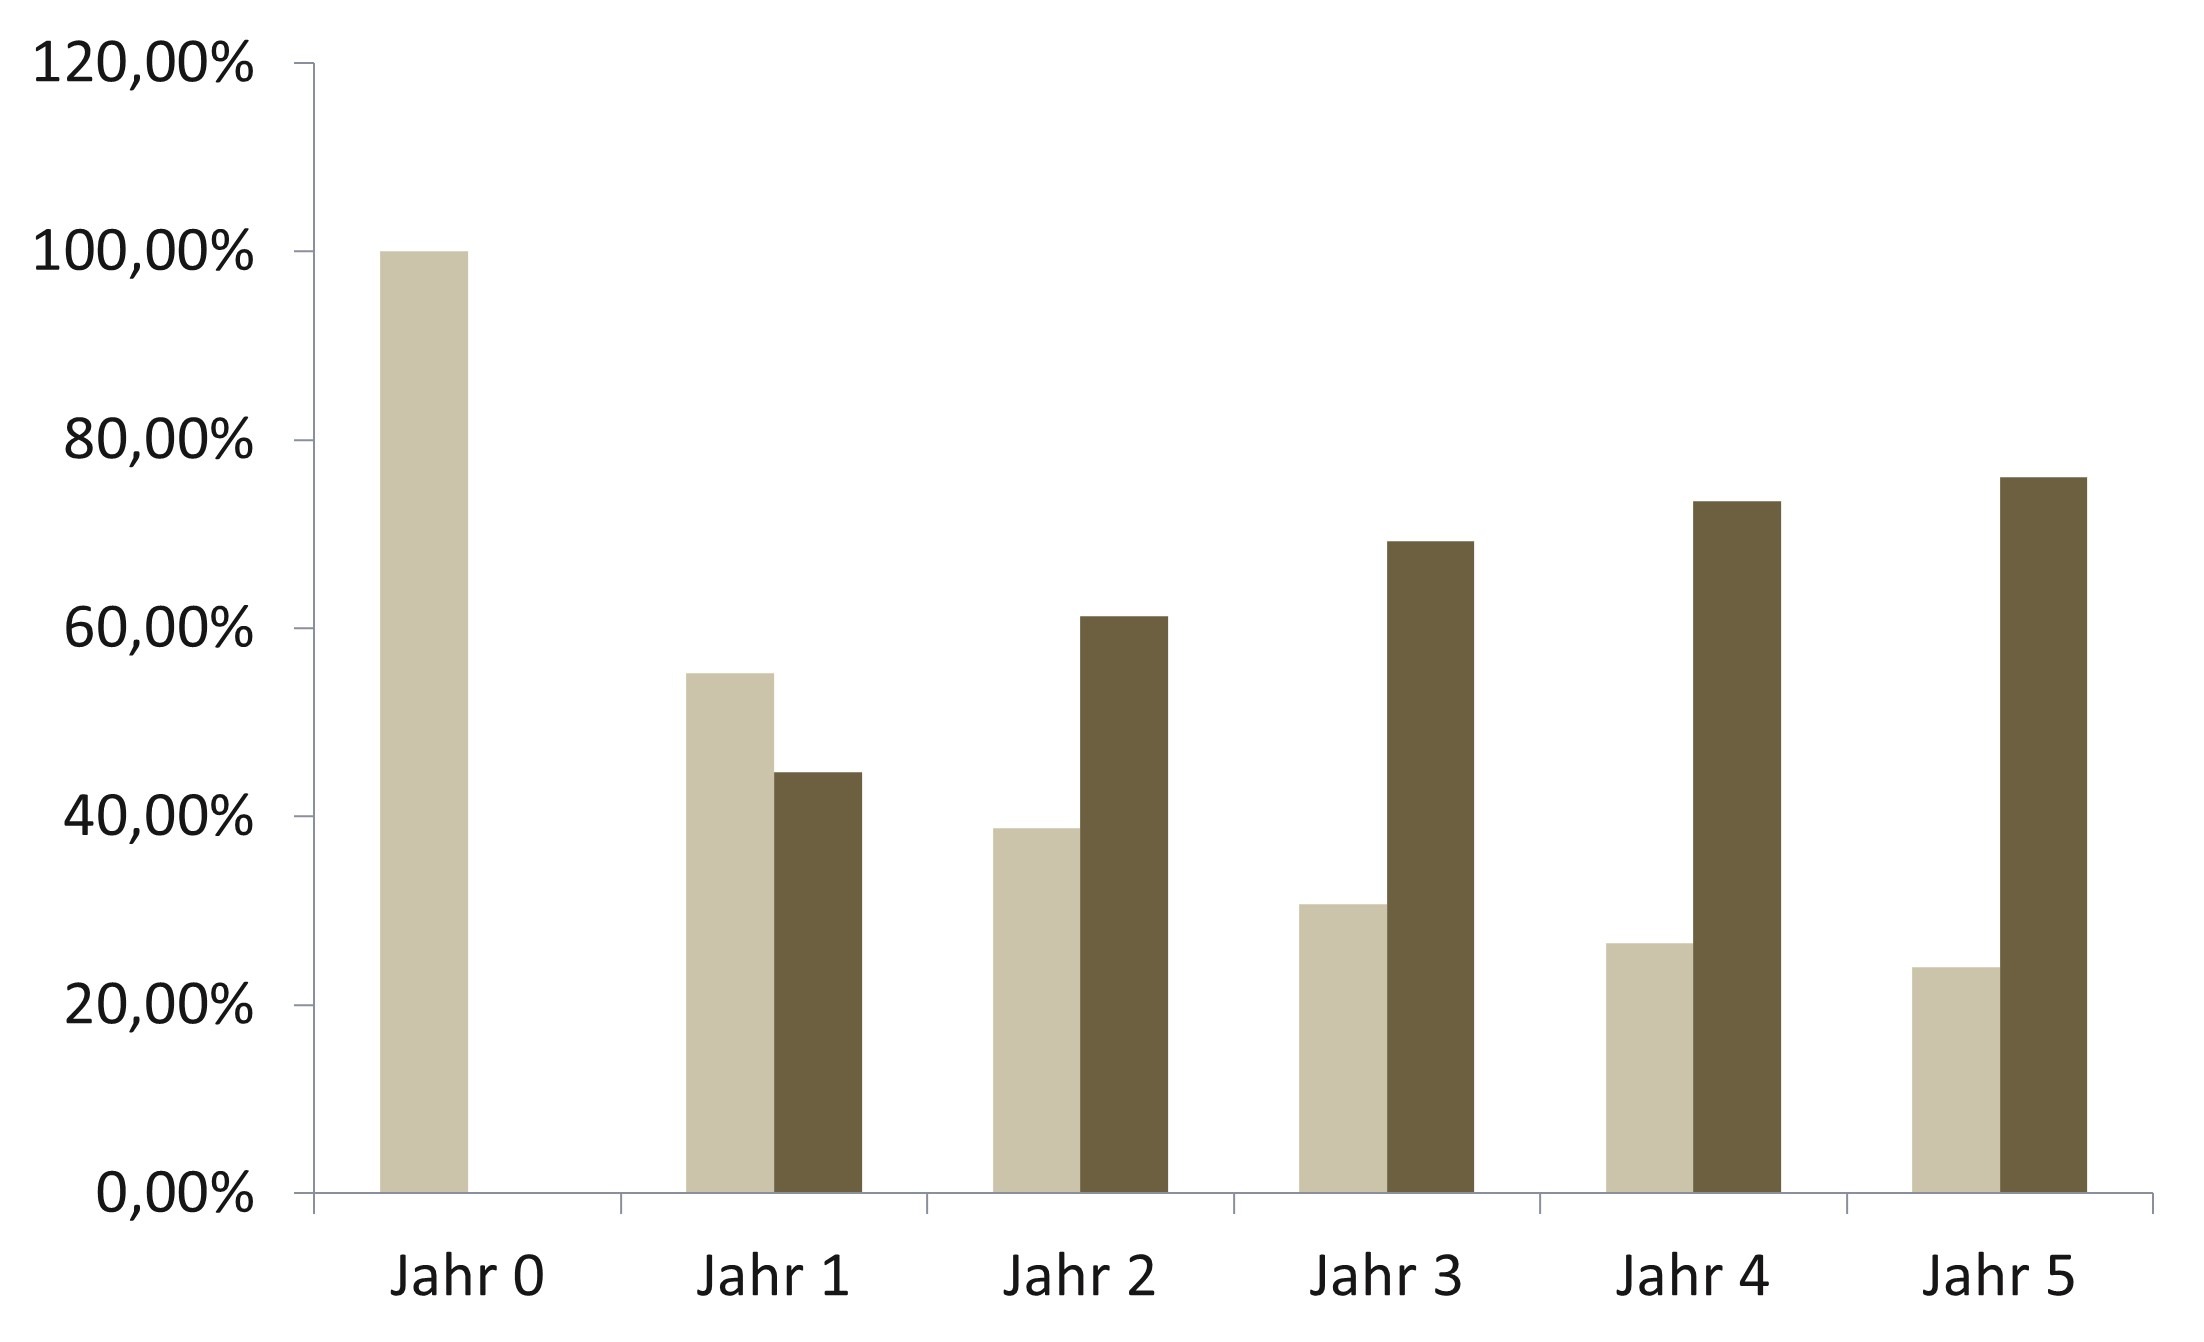
The analysis of the portfolio shows that after 6 years there is a clear shift towards maintenance costs. While the development costs increase slightly with the same annual scope of functions, the maintenance costs increase continuously due to the overall scope.
Due to the growing IT product portfolio, the effects are most serious in the run area. Figure 2 shows how the scope of functions changes between new development and the scope of maintenance.
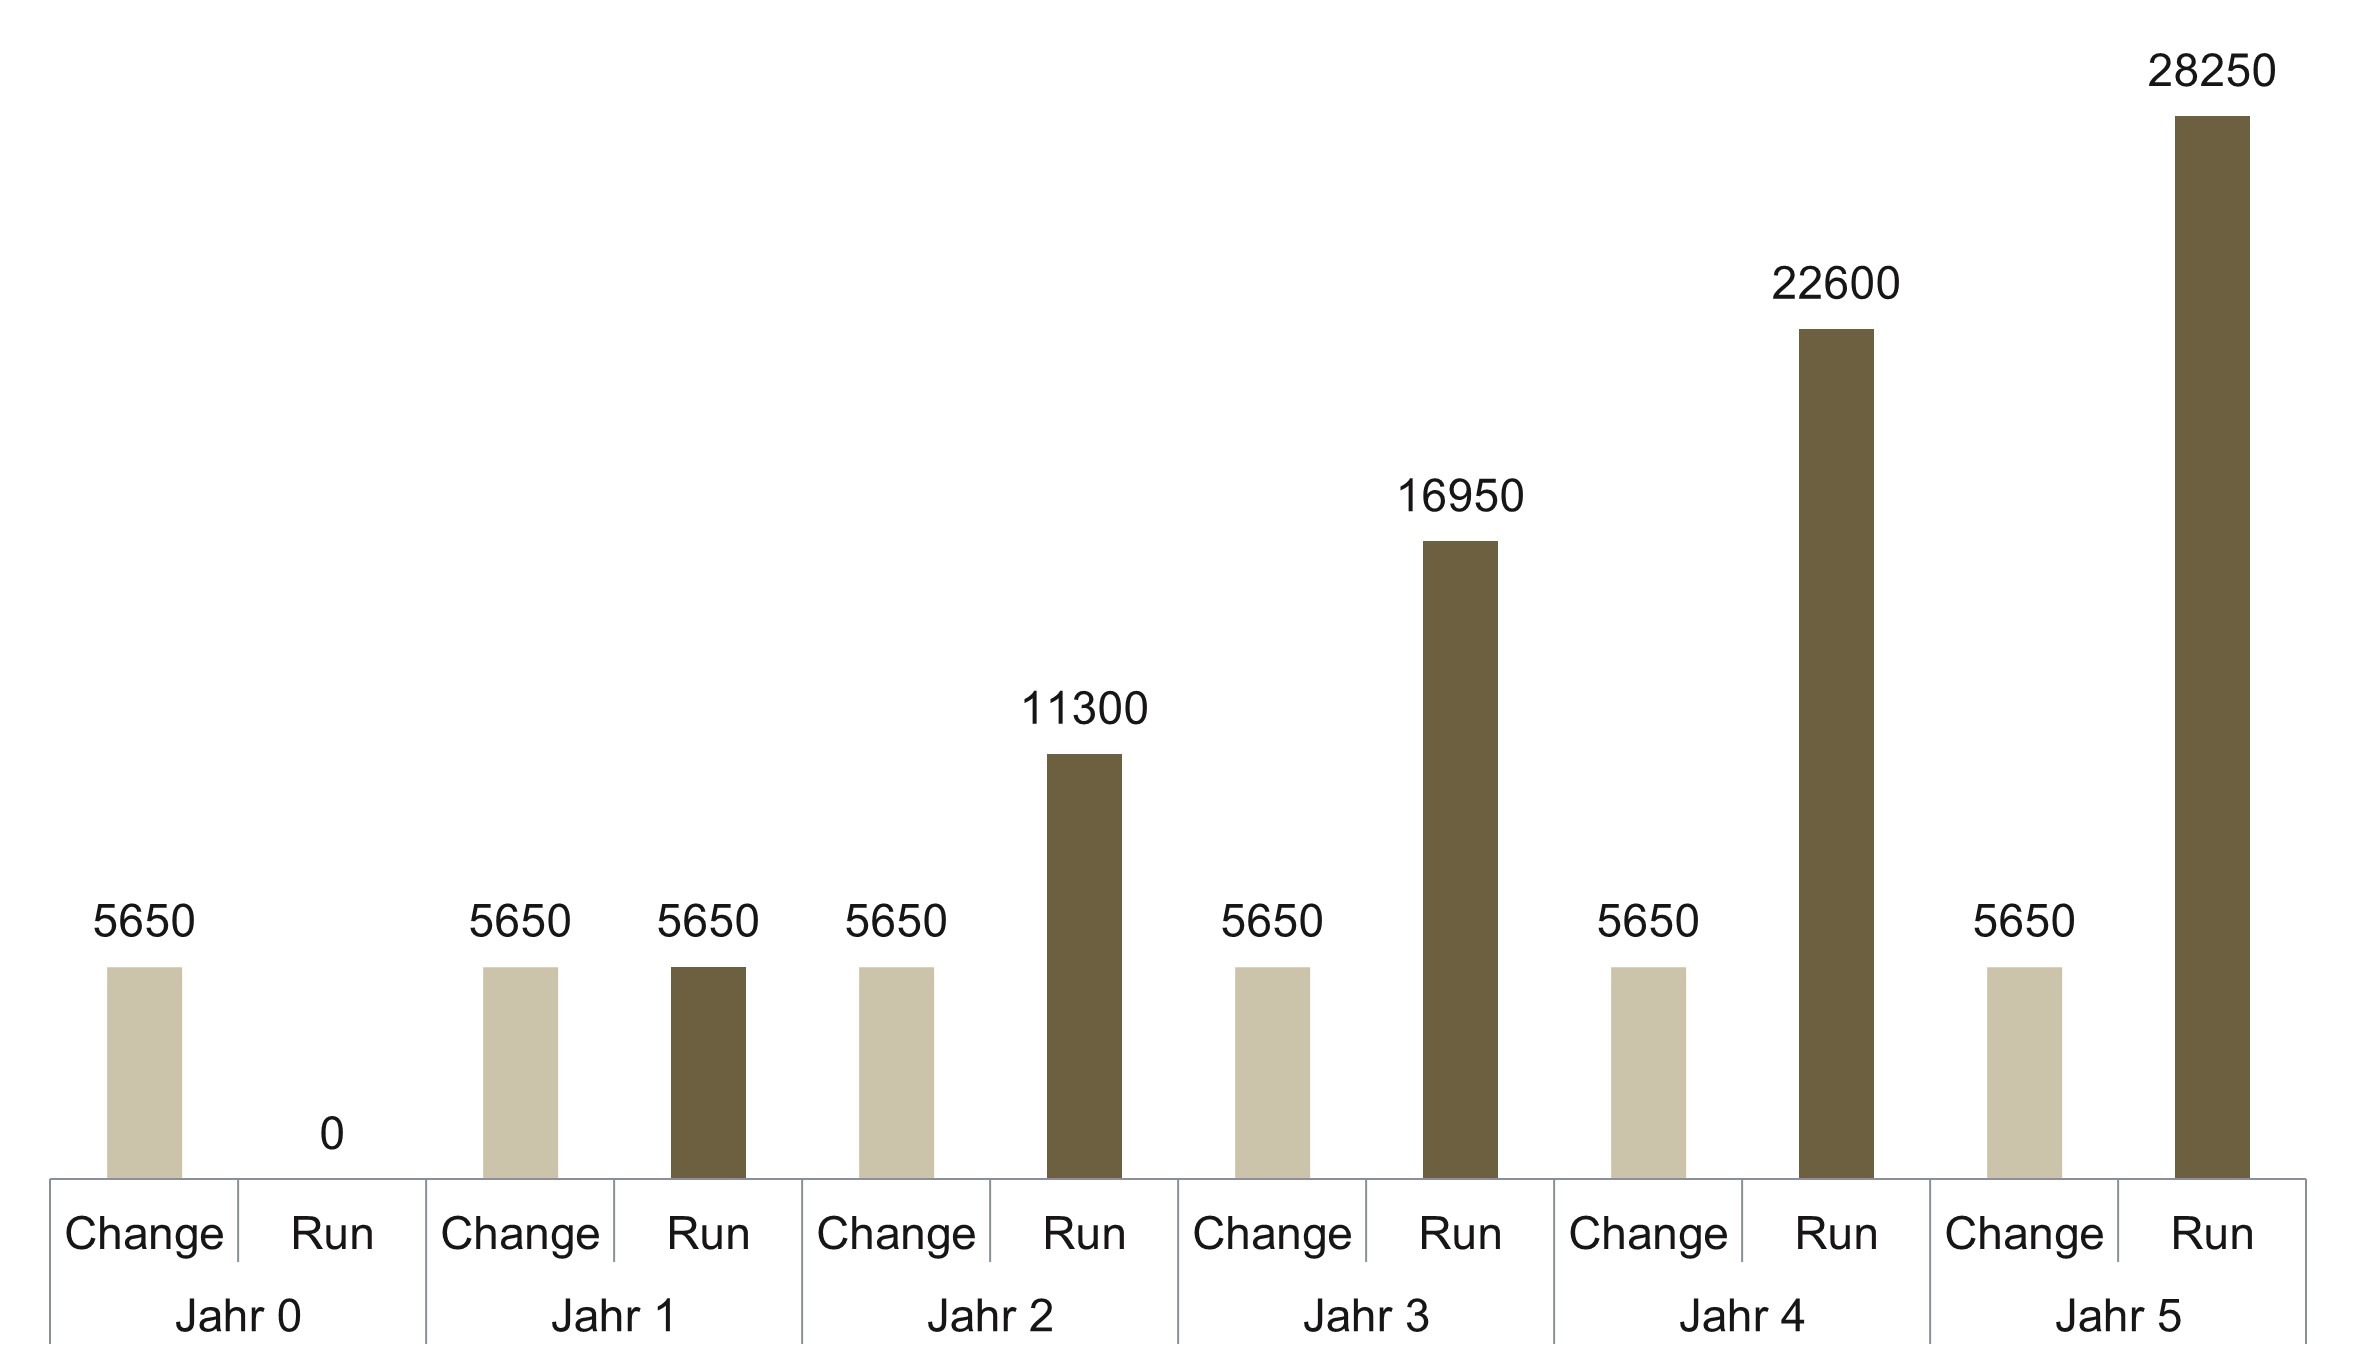
The effects of the budget distribution between Change and Run as a percentage also show how the distribution of initially 100% Change and 0% Run changes to a ratio of 25% Change and 75% Run after just 5 years of operation.
The concrete approach of the BAMAC GROUP
In the following, we present our specific approachto answering the key question. As illustrated above, the existing IT products and their functions, as well as the associated expenditure data for development (Change) and maintenance (Run), form the basis of analysis for the BAMAC GROUP. The functional analysis is usually carried out on the basis of the existing documentation. Where no documentation is available, the analysis is carried out in workshops.
The BAMAC GROUP relies on the input of IT Controlling to collect actual data. The quality of the data is an important indicator of the quality of the forecasts made. Mathematical instruments (in particular statistical error analyses) can be used to compensate for any incompleteness.
Result of the analysis of the life cycle costs of IT products
We have already answered the key question about the development of life cycle costs above. At the same time, a new question arises: Is this cost trend unavoidable or is it possible to increase the proportion of new functions or reduce the proportion of maintenance costs without increasing the IT budget?
Is it possible to increase the proportion of change without increasing the overall IT budget?
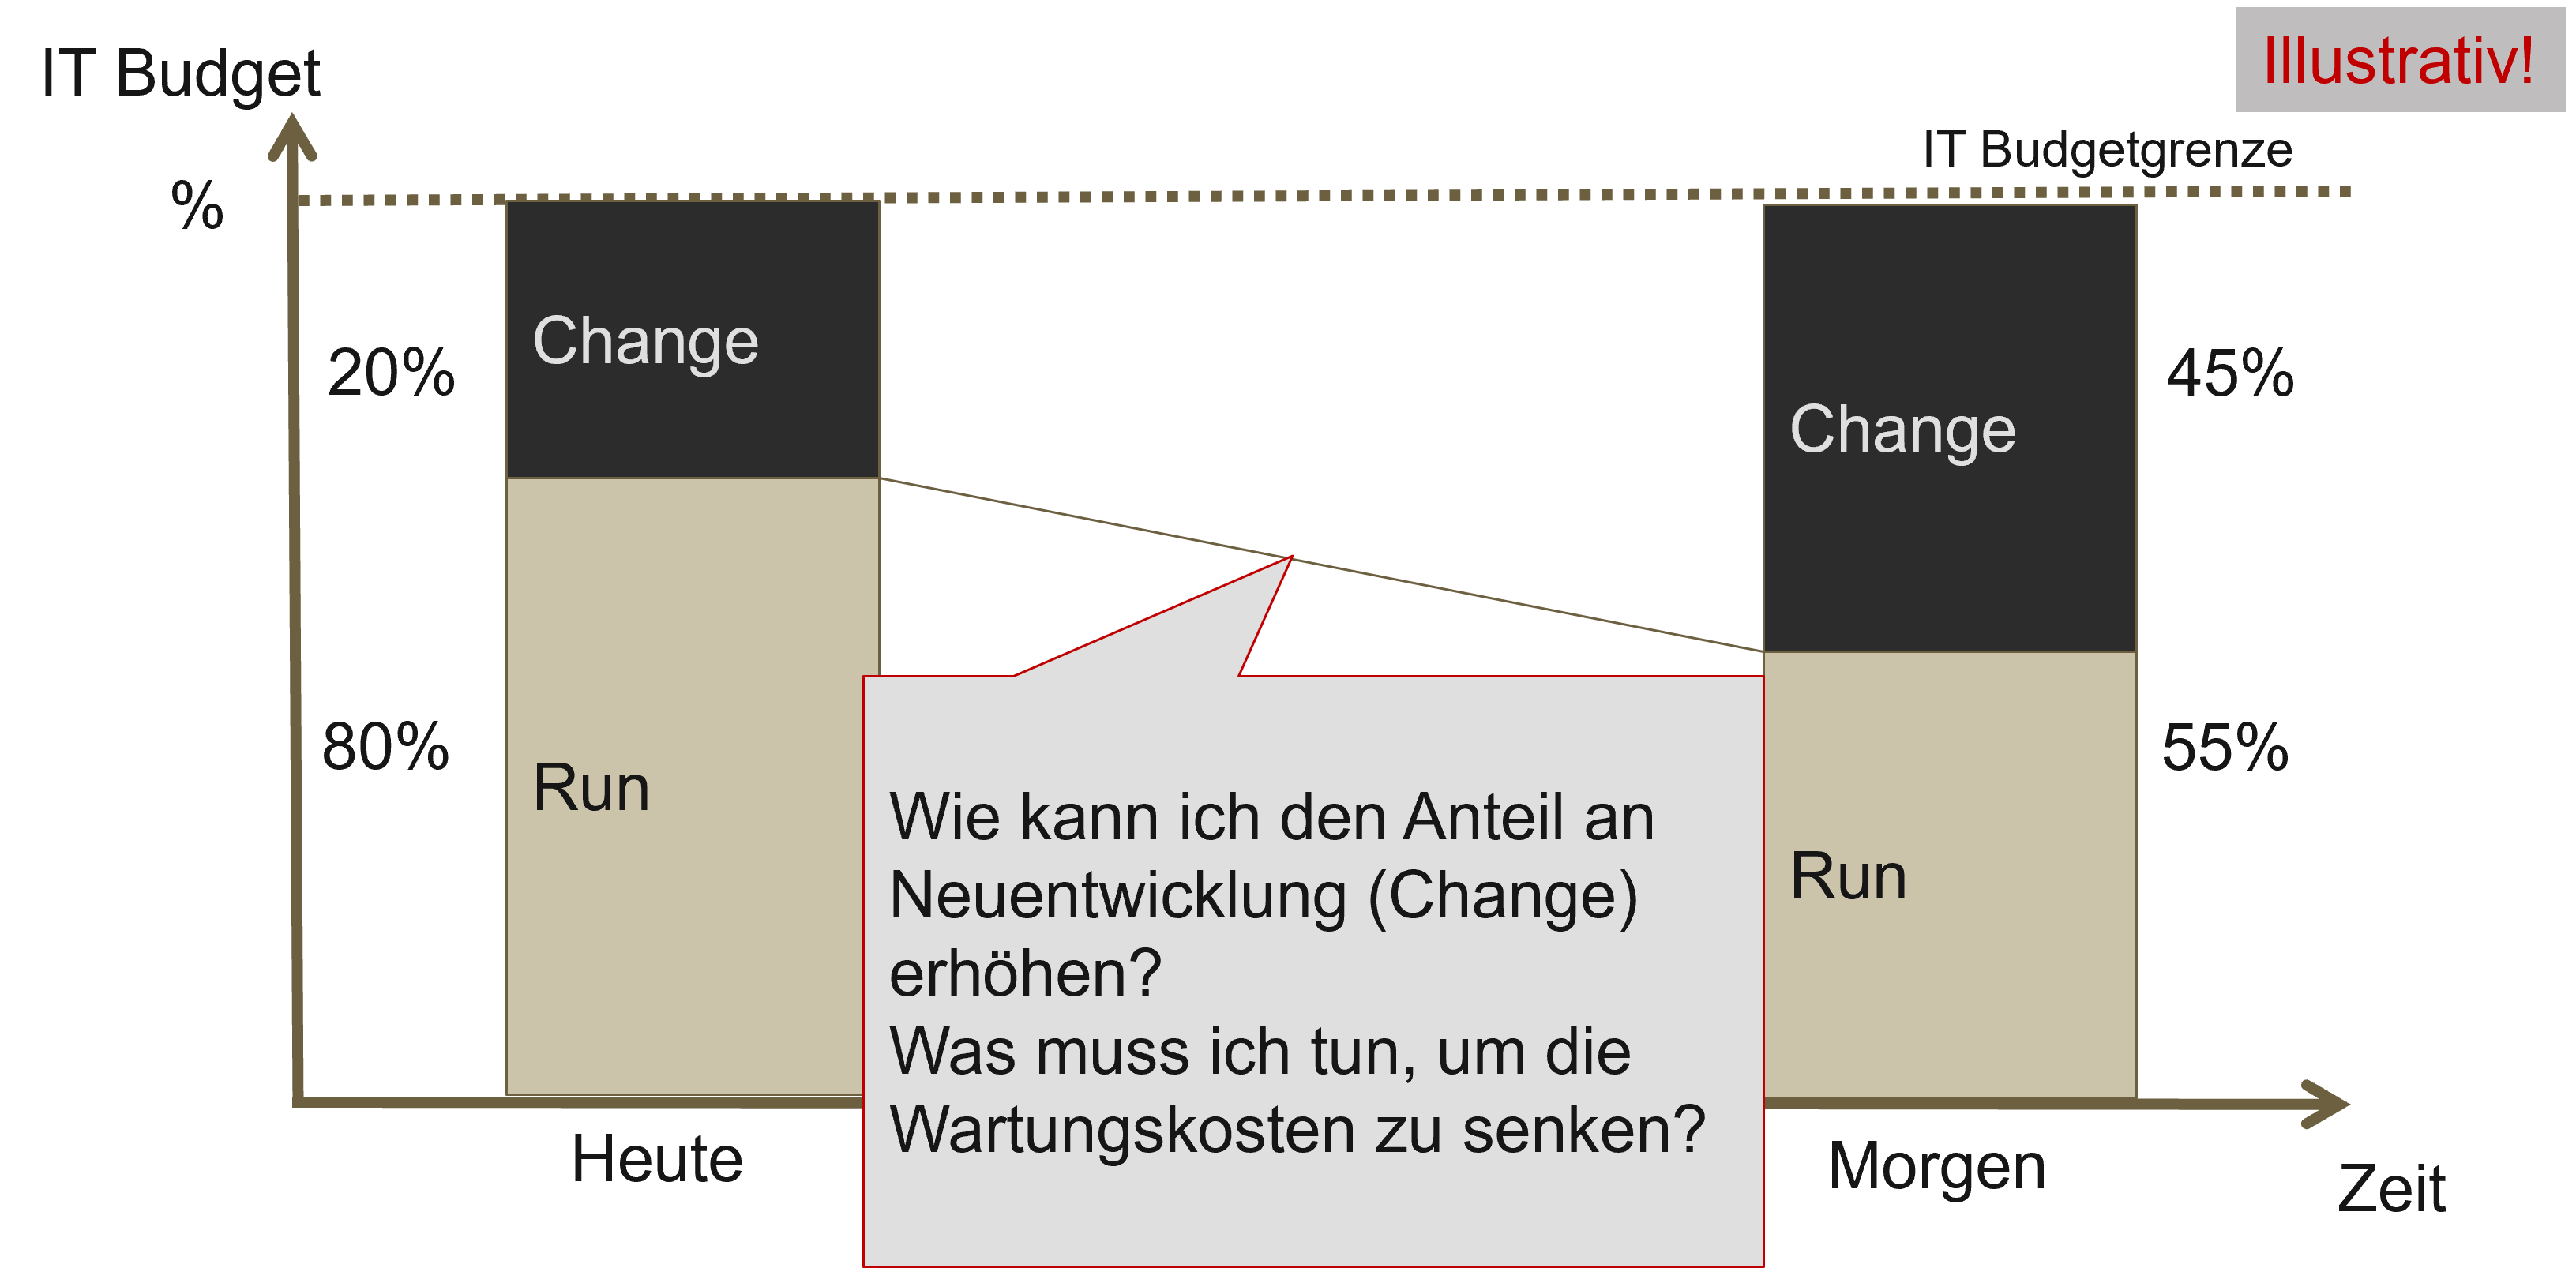
This case study shows how the distribution of costs for Change and Run has changed over the course of six years. This was done in order to identify possibilities for optimizing the current situation. The graphic illustrates this optimization process.
Optimization options for the life cycle costs of IT products
In order to counteract this shift in life cycle costs, we present ways that have emerged from our decades of practical experience, which optimize the distribution of costs and increase the efficiency of your IT products.
The following measures can be used to optimize and increase efficiency:
- Remove functionalities that are no longer used
Functionalities that you no longer need but remain in the system must be maintained. You therefore tie up capital that is of no benefit to you. There is potential above all in obsolete functionalities for process support or products that are no longer used.
- Replace legacy systems
Check whether you should continue to develop your legacy systems or whether a replacement strategy will enable more economical operation.
- Standardize processes and functions – do without arabesques
Break down particularly nuanced products and merge the application areas. Again and again we find applications in several variants in one organization (e.g. billing systems). This is often due to the merger of new companies or reorganization within groups. After these reorganizations, it is often forgotten to adapt the system landscape.
- Consolidate data and functions
Reduce redundancies in both data (e.g. customer data) and functions (e.g. accounting systems).
- Make your decision based on productivity criteria
Consistently check your IT portfolio for efficiency as early as the planning phase.
Is your development set up optimally in terms of development costs?
What about maintenance?
Check productivity and, if necessary, implement measures to increase productivity (e.g. qualification of employees, modularization of the architecture, optimization of the workplace environment and consolidation of development locations).
These tips will take you a long way towards optimizing your IT portfolio. If you have any questions, please contact us!
A general overview of the topic of IT portfolio management can be found here! Here we have explained why well thought-out IT product portfolio management is the decisive success factor for companies and here we have presented the special features of the BAMAC GROUP’s IT product portfolio management.
About the author

Categories of this post
Further interesting posts.

In this article, we want to use a specific case study to show how much knowledge can be gained, and therefore how much money can be saved, when annual IT planning and rolling planning go hand in hand.

In this article, we use an example from our practice to show you how IT benchmarking can be used to determine your own position and make a course correction.

Which measures and projects are important for the company’s success? Which measures add the most value to your company? How do you react to market changes with regard to measures and projects? How do you maintain an overview between prioritizations and rolling changes?

Due to the discrepancy between the number of IT projects and the available budget and resources, it is necessary to prioritize the projects so that they can be implemented within the current capacities.