Case Study: Optimizing costs in the IT project portfolio
You have identified and evaluated your IT projects within your IT project portfolio and are now asking yourself the question: Can’t it be done more cheaply?
In this article, we use a case study from our practice to show you what cost optimization within the IT project portfolio can look like.
Can’t it be done more cheaply?
You have identified and evaluated your IT projects within your IT project portfolio and now you are asking yourself the question:
Can’t it be done more cheaply?
It goes without saying that cost optimization in the IT project portfolio also makes a significant contribution to increasing the value of a company. The instrument that contributes significantly to the increase in knowledge is the third-party comparison.
Cost optimization in the IT project portfolio
The BAMAC GROUP can support you here. Based on a data volume of more than 12,000 projects, we can provide you with targeted data from the IT portfolio for a market comparison. Our database includes comparative values for in-house development, standard software and hybrid systems. In this article, we use a case study from our practice to show you what cost optimization within the IT project portfolio can look like.
Process for optimizing costs in the IT project portfolio
The initial procedure is the same as for the cost estimate(see here for details). Once the project has been evaluated, a comparison is made with third parties. Among other things, we identify projects from the top quartile and determine cost effects. In the course of this, we use the following key figures as evaluation dimensions:
- Industry
- Project parameters (e.g. type of project, scope, topology)
- Employees
- Technology
- Process
- Project environment
- Product
- Size/complexity
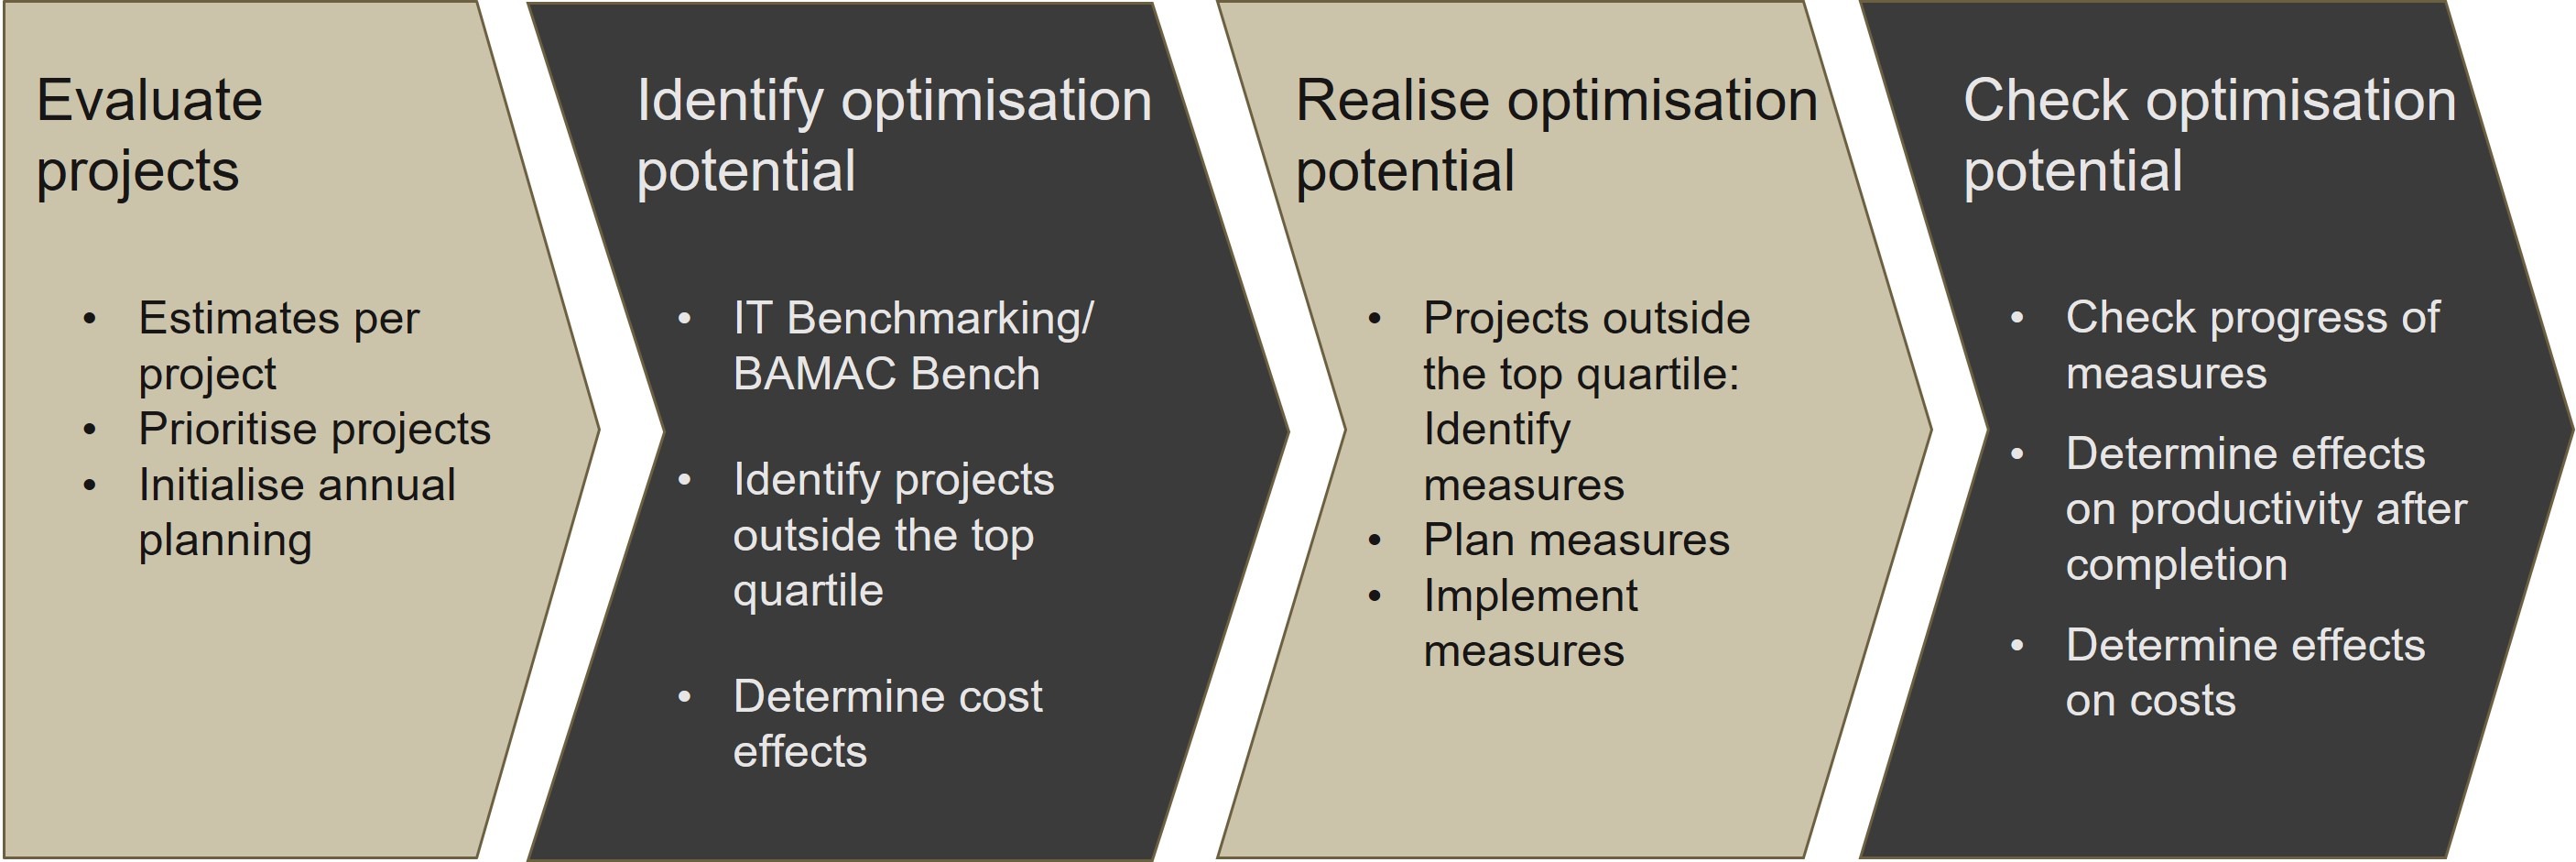
We state the optimization potential we obtain in both person days (PD) and euros ( EUR). Measures for optimizing the individual projects are then presented, the implementation of which would place the project in the top quartile. can bring. The consistent implementation of the optimization suggestions can therefore make the IT project one of the best 25% in its category. The figure below illustrates the process of cost optimization in the IT project portfolio.
Concrete steps to optimize costs
In the following case study, we show the evaluation of the identified optimization potential in more detail. Based on the identified function points and the information from the baseline, we determine the expenditure for the projects.
Step 1: Evaluate projects
For this purpose, we use the boundary conditions agreed in the organization. The expenses between the specialist area and IT are in a ratio of 2/3 to 1/3. The daily rates for 8 hours are EUR 870 for the specialist area and EUR 1000 for IT. In the following, we obtain the data from Figure 2.
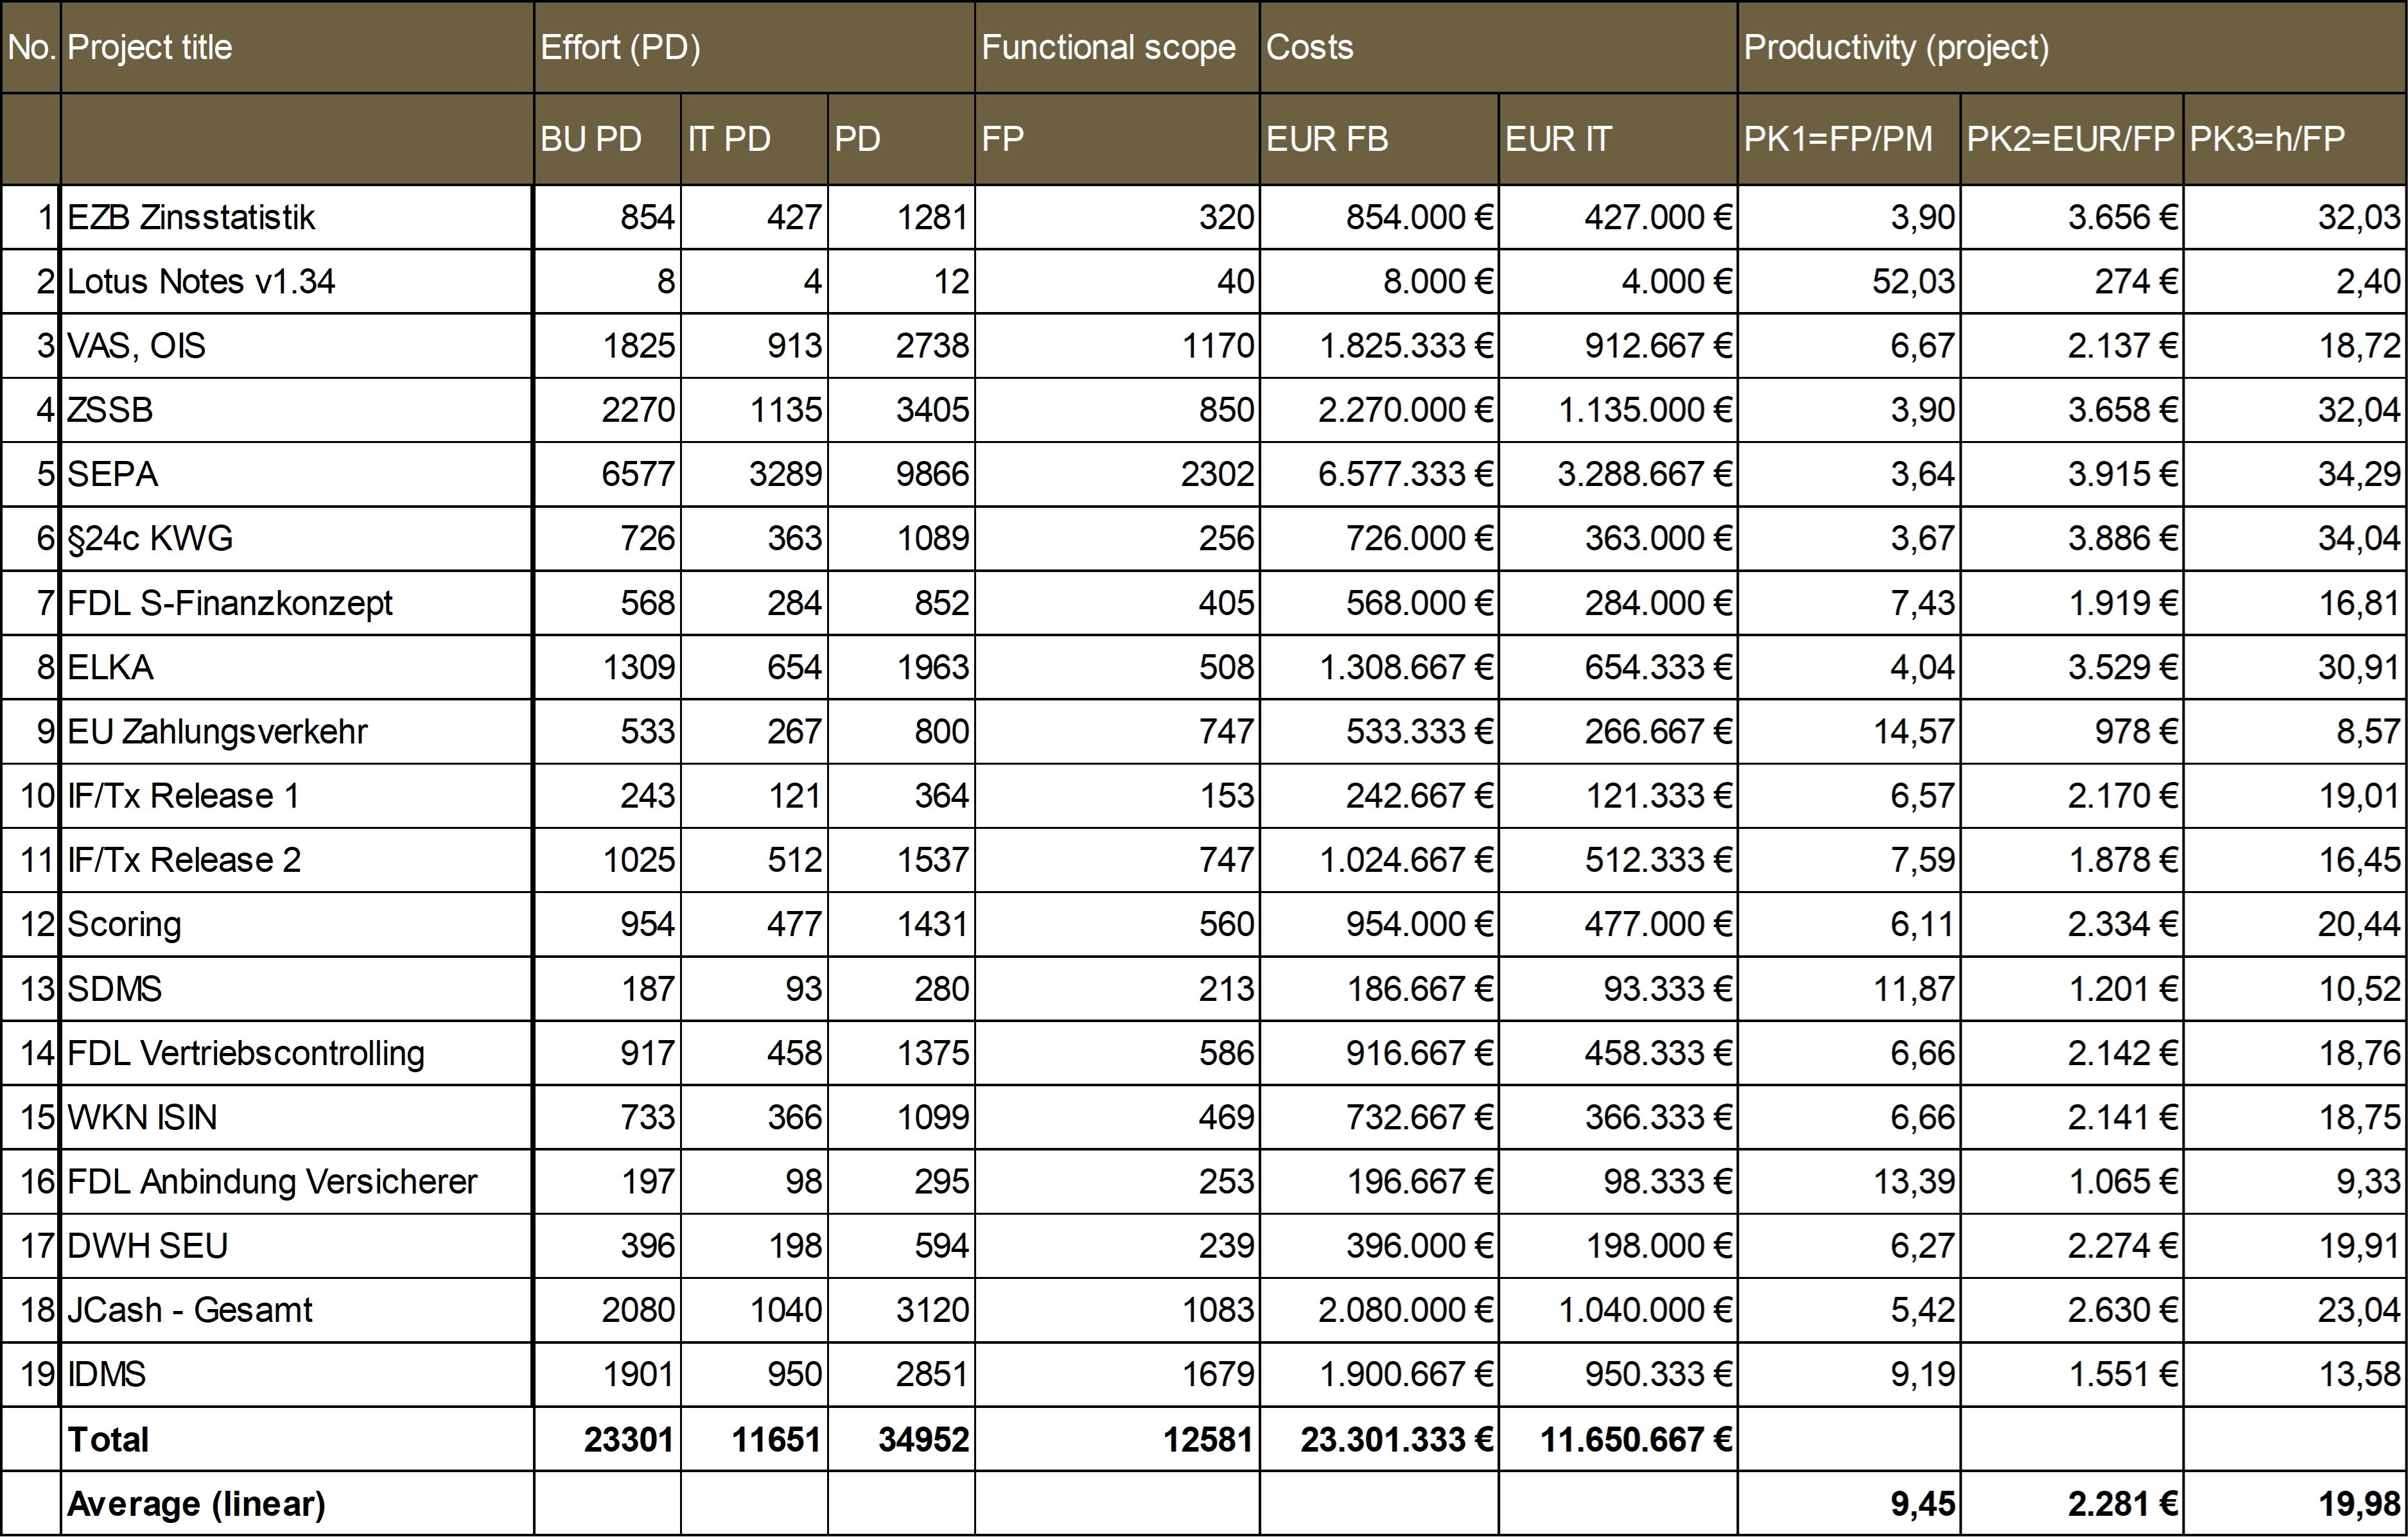
Once we have calculated the effort per project, the next step is to determine the data per project from the top quartile.
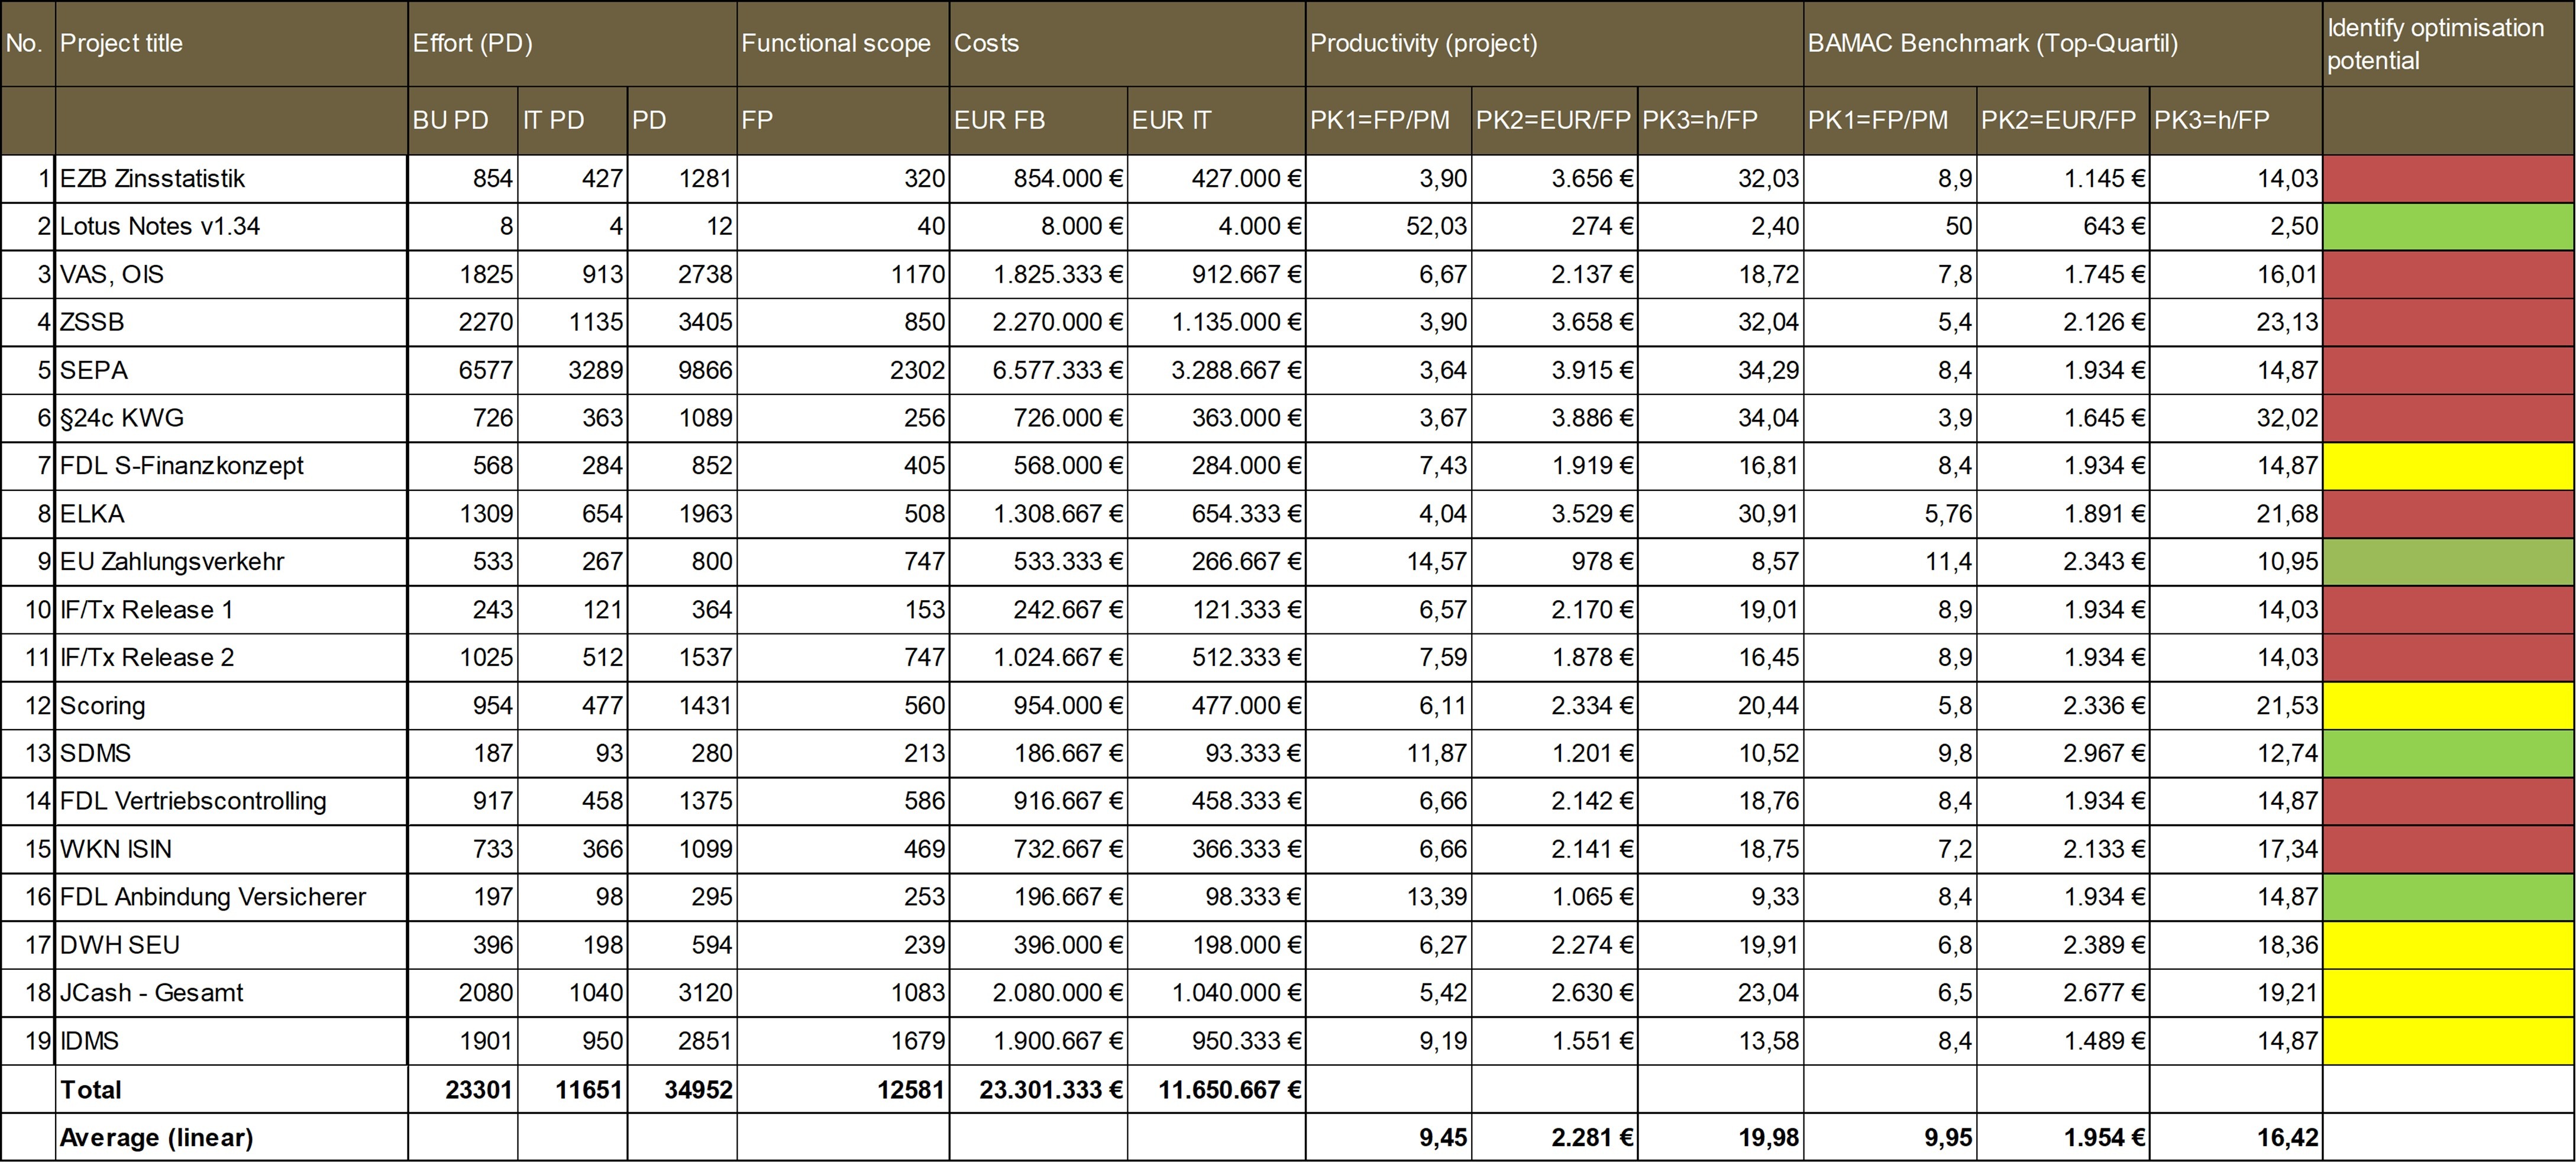
Step 2: Identify optimization potential
To do this, we identify the relevance for the benchmark based on the similarity characteristics. The productivity values determined are shown and compared with the company values. In addition, we used comparative values from the BAMAC GROUP database to work out the cost optimization in the IT project portfolio of the analyzed company. An initial result can already be seen in an overview at this point. For the sake of simplicity, we use a traffic light system. All projects that are below the market comparison for development time (PK1) and above the costs (PK2) are marked red. A project is “yellow” if one of the two values in the project is better and finally a project is “green” if both the development time (PK1) is above the top quartile and the costs (PK2) are lower than in the top quartile.
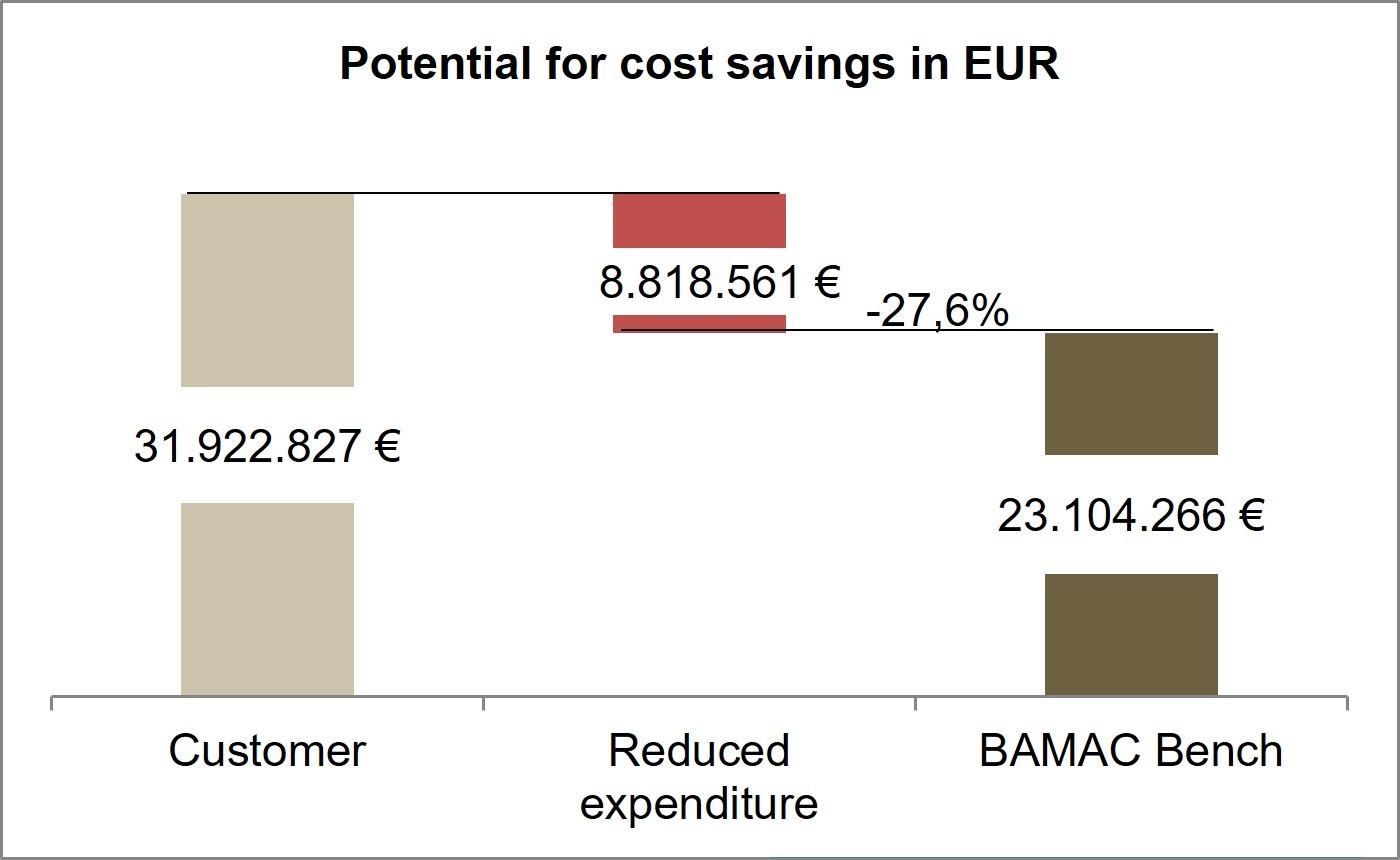
If we now apply the results from the benchmark of the BAMAC GROUP, we obtain a savings potential of 9655 PT for the IT project portfolio examined here (see Figure 4) – this corresponds to an expenditure of approx. 60 FTEs.
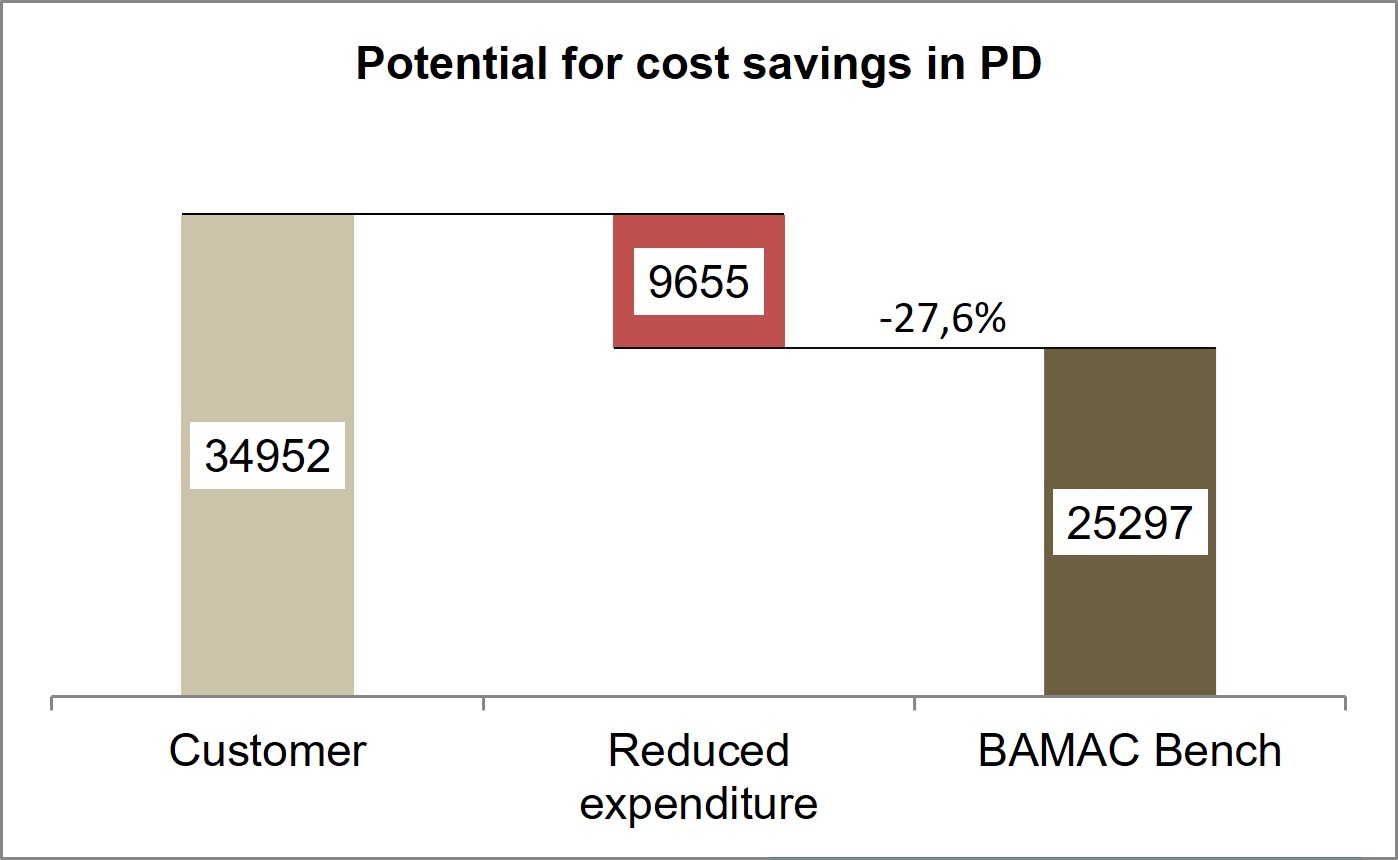
Converted to costs, this corresponds to an optimization potential of around EUR 8.8 million.
Using the potential for cost optimization in the IT project portfolio
Please note: The one-off costs incurred in implementing the productivity-enhancing measures must be offset against the potential savings! During the implementation of the optimization proposals, additional process-improving measures are often carried out. These often focus on monetary benefits. It should also be noted that the cost optimizations must be evaluated under the premise that the functional scope of the IT project to be optimized remains unchanged. We have explained here why the effort and functional scope of IT projects are not linear and therefore not intuitive.
As has been shown, our optimization approach differs considerably from other methods used in practice. These often only correspond to a disguised cost reduction.
With the financial leeway gained, we significantly increase the customer’s ability to optimize and better organize their IT project portfolio. This can be achieved, for example, by reducing the backlog of applications with existing resources and/or through cost savings in the existing budget.
Further case studies from our IT portfolio management practice can be found here:
IT project portfolio management – keep an overview!
Case Study – Life cycle costs of IT products
Case Study – Make or Buy – The first glance can be deceptive
About the author

Categories of this post
Further interesting posts.

In this article, we show you how we manage your IT product portfolio and present our tried-and-tested approach, which has already helped numerous customers to design and use their IT systems even more efficiently.

Within IT portfolio management, IT product portfolio management focuses on application systems and products. This article explains what the decisive success factor of IT product portfolio management is, what questions it answers and what concrete advantages companies can gain from implementing it.

A secure supply chain is worth its weight in gold, as it ensures your company’s long-term success. The Financial Risk Report is our tried and tested tool that makes supplier evaluation much easier for you.

In recent years, we have witnessed an unprecedented explosion of innovations in the IT sector that have revolutionized our daily lives and challenged us at the same time. IT efficiency seemed to have been lost during this time, but now it is returning.